Have you ever found yourself in the situation to finish a project and you’re about to deliver it to the Ops team. You’re so happy because this time, you covered all the bases: the documentation contains the JNDI datasource name the application will use, all environment-dependent parameters have been externalized in a property file - and documented, and you even made sure logging has been implemented at key points in the code. Unfortunately, Ops refuse your delivery since they don’t know how to monitor the new application. And you missed that… Sure you could hack something to fulfill this requirement, but the project is already over-budget. In some (most?) companies, this means someone will have to be blamed and chances are the developer will bear all the burden. Time for some sleepless nights.
Spring Boot is a product from Spring that brings many out-of-the-box features to the table. Convention over configuration, in-memory default datasource and and embedded Tomcat are part of the features known to most. However, I think there’s a hidden gem that should be much more advertised. The actuator module actually provides metrics and health checks out-of-the-box as well as an easy way to add your own. In this article, we’ll see how to access those metrics from HTTP and send them to JMX and Graphite.
As an example application, let’s use an update of the Spring Pet Clinic made with Boot - thanks forArnaldo Piccinelli for his work. The starting point is commit 790e5d0. Now, let’s add some metrics in no time.
The first step is to add the actuator module starter in the Maven POM and let Boot does its magic:
<dependency>
    <groupId>org.springframework.boot</groupId>
    <artifactId>spring-boot-starter-actuator</artifactId>
</dependency>
At this point, we can launch the Spring Pet Clinic with mvn spring-boot:run and navigate to http://localhost:8090/metrics (note that the path is protected by Spring Security, credentials are user/password) to see something like the following:
{
  "mem" : 562688,
  "mem.free" : 328492,
  "processors" : 8,
  "uptime" : 26897,
  "instance.uptime" : 18974,
  "heap.committed" : 562688,
  "heap.init" : 131072,
  "heap.used" : 234195,
  "heap" : 1864192,
  "threads.peak" : 20,
  "threads.daemon" : 17,
  "threads" : 19,
  "classes" : 9440,
  "classes.loaded" : 9443,
  "classes.unloaded" : 3,
  "gc.ps_scavenge.count" : 16,
  "gc.ps_scavenge.time" : 104,
  "gc.ps_marksweep.count" : 2,
  "gc.ps_marksweep.time" : 152
}
As can be seen, Boot provides hardware- and Java-related metrics without further configuration. Even better, if one browses the app e.g. repeatedly refreshed the root, new metrics appear:
{
  "counter.status.200.metrics" : 1,
  "counter.status.200.root" : 2,
  "counter.status.304.star-star" : 4,
  "counter.status.304.webjars.star-star" : 1,
  "gauge.response.metrics" : 72.0,
  "gauge.response.root" : 16.0,
  "gauge.response.star-star" : 8.0,
  "gauge.response.webjars.star-star" : 11.0,
  ...
}
Those metrics are more functional in nature, and they are are separated into two separate groups:
- Gauges are the simplest metrics and return a numeric value e.g.
gauge.response.rootis the time (in milliseconds) of the last response from the/metricspath - Counters are metrics which can be incremented/decremented e.g.
counter.status.200.metricsis the number of times the/metricspath returned a HTTP 200 code
At this point, your Ops team could probably scrape the returned JSON and make something out of it. It will be their responsibility to regularly poll the URL and to use the figures the way they want. However, with just a little more effort, we can ease the life of our beloved Ops team by putting these metrics in JMX.
Spring Boot integrates easily with Dropwizard metrics. By just adding the following dependency to the POM, Boot is able to provide a MetricRegistry, a Dropwizard registry for all metrics:
<dependency>
    <groupId>io.dropwizard.metrics</groupId>
    <artifactId>metrics-core</artifactId>
    <version>4.0.0-SNAPSHOT</version>
</dependency>
Using the provided registry, one is able to send metrics to JMX in addition to the HTTP endpoint. We just need a simple configuration class as well as a few API calls:
@Configuration
public class MonitoringConfig {

    @Autowired
    private MetricRegistry registry;

    @Bean
    public JmxReporter jmxReporter() {
        JmxReporter reporter = JmxReporter.forRegistry(registry).build();
        reporter.start();
        return reporter;
    }
}
Launching jconsole let us check it works alright:
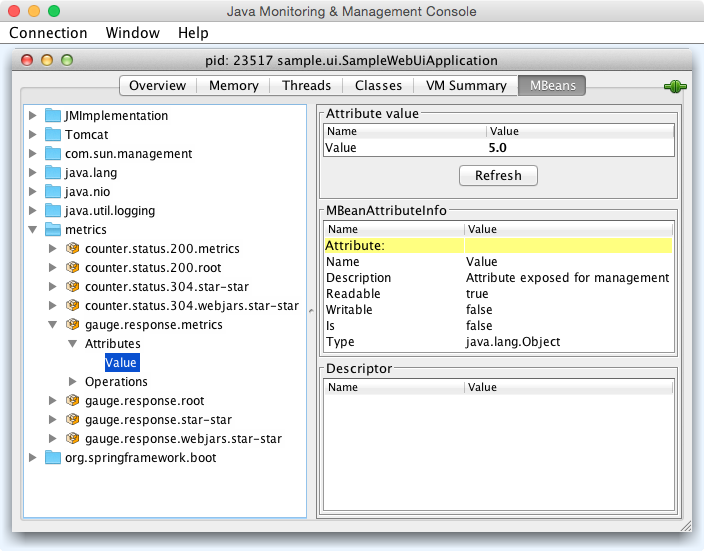
The Ops team now just needs to get metrics from JMX and push them into their preferred graphical display tool, such as Graphite. One such way to achieve this is through jmx-trans. However, it’s also possible to directly send metrics to the Graphite server with just a few different API calls:
@Configuration
public class MonitoringConfig {

    @Autowired
    private MetricRegistry registry;

    @Bean
    public GraphiteReporter graphiteReporter() {
        Graphite graphite = new Graphite(new InetSocketAddress("localhost", 2003));
        GraphiteReporter reporter = GraphiteReporter.forRegistry(registry)
                                                    .prefixedWith("boot").build(graphite);
        reporter.start(500, TimeUnit.MILLISECONDS);
        return reporter;
    }
}
The result is quite interesting given the few lines of code:
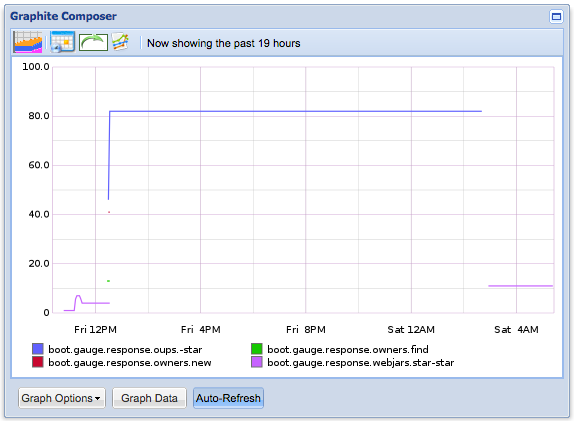
Note that going to Graphite using the JMX route makes things easier as there’s no need for a dedicated Graphite server in development environments.