

This week’s post aims to describe how to send JMX metrics taken from the JVM to an Elasticsearch instance.
Business app requirements
The business app(s) has some minor requirements.
The easiest use-case is to start from a Spring Boot application. In order for metrics to be available, just add the Actuator dependency to it:
<dependency>
  <groupId>org.springframework.boot</groupId>
  <artifactId>spring-boot-starter-actuator</artifactId>
</dependency>
Note that when inheriting from spring-boot-starter-parent, setting the version is not necessary and taken from the parent POM.
To send data to JMX, configure a brand-new @Bean in the context:
@Bean @ExportMetricWriter
MetricWriter metricWriter(MBeanExporter exporter) {
    return new JmxMetricWriter(exporter);
}
To-be architectural design
There are several options to put JMX data into Elasticsearch.
Possible options
- The most straightforward way is to use Logstash with the JMX plugin
- Alternatively, one can hack his own micro-service architecture:
- Let the application send metrics to the JVM - there’s the Spring Boot actuator for that, the overhead is pretty limited
- Have a feature expose JMX data on an HTTP endpoint using Jolokia
- Have a dedicated app poll the endpoint and send data to Elasticsearch
This way, every component has its own responsibility, there’s not much performance overhead and the metric-handling part can fail while the main app is still available.
- An alternative would be to directly poll the JMX data from the JVM
Unfortunate setback
Any architect worth his salt (read lazy) should always consider the out-of-the-box option.
The Logstash JMX plugin looks promising.
After installing the plugin, the jmx input can be configured into the Logstash configuration file:
input {
  jmx {
    path => "/var/logstash/jmxconf"
    polling_frequency => 5
    type => "jmx"
  }
}

output {
  stdout { codec => rubydebug }
}
The plugin is designed to read JVM parameters (such as host and port), as well as the metrics to handle from JSON configuration files.
In the above example, they will be watched in the /var/logstash/jmxconf folder.
Moreover, they can be added, removed and updated on the fly.
Here’s an example of such configuration file:
{
  "host" : "localhost",
  "port" : 1616,
  "alias" : "petclinic",
  "queries" : [
  {
    "object_name" : "org.springframework.metrics:name=*,type=*,value=*",
    "object_alias" : "${type}.${name}.${value}"
  }]
}
A MBean’s ObjectName can be determined from inside the jconsole:
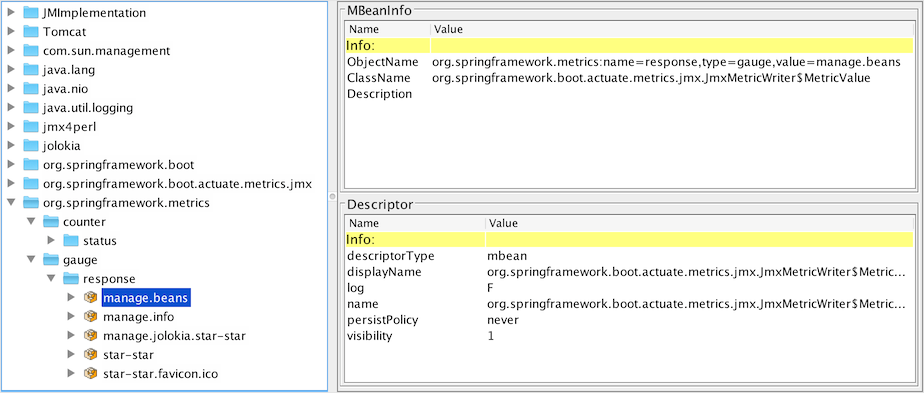
The plugin allows wildcard in the metric’s name and usage of captured values in the alias. Also, by default, all attributes will be read (those can be restricted if necessary).
Note: when starting the business app, it’s highly recommended to set the JMX port through the com.sun.management.jmxremote.port system property.
Unfortunately, at the time of this writing, running the above configuration fails with messages of this kind:
[WARN][logstash.inputs.jmx] Failed retrieving metrics for attribute Value on object blah blah blah
[WARN][logstash.inputs.jmx] undefined method `event' for =<LogStash::Inputs::Jmx:0x70836e5d>
For reference purpose, the Github issue can be found here.
The do-it yourself alternative
Considering it’s easier to poll HTTP endpoints than JMX - and that implementations already exist, let’s go for option 3 above. Libraries will include:
- Spring Boot for the business app
- With the Actuator starter to provides metrics
- Configured with the JMX exporter for sending data
- Also with the dependency to expose JMX beans on an HTTP endpoints
- Another Spring Boot app for the "poller"
- Configured with a scheduled service to regularly poll the endpoint and send it to Elasticsearch

Additional business app requirement
To expose the JMX data over HTTP, simply add the Jolokia dependency to the business app:
<dependency>
  <groupId>org.jolokia</groupId>
  <artifactId>jolokia-core</artifactId>
 </dependency>
From this point on, one can query for any JMX metric via the HTTP endpoint exposed by Jolokia - by default, the full URL looks like /jolokia/read/<JMX_ObjectName>.
Custom-made broker
The broker app responsibilities include:
- reading JMX metrics from the business app through the HTTP endpoint at regular intervals
- sending them to Elasticsearch for indexing
My initial move was to use Spring Data, but it seems the current release is not compatible with Elasticsearch latest 5 version, as I got the following exception:
java.lang.IllegalStateException:
  Received message from unsupported version: [2.0.0] minimal compatible version is: [5.0.0]
Besides, Spring Data is based on entities, which implies deserializing from HTTP and serializing back again to Elasticsearch: that has a negative impact on performance for no real added value.
The code itself is quite straightforward:
@SpringBootApplication (1)
@EnableScheduling (2)
open class JolokiaElasticApplication {

  @Autowired lateinit var client: JestClient (6)

  @Bean open fun template() = RestTemplate() (4)

  @Scheduled(fixedRate = 5000) (3)
  open fun transfer() {
    val result = template().getForObject( (5)
      "http://localhost:8080/manage/jolokia/read/org.springframework.metrics:name=status,type=counter,value=beans",
      String::class.java)
    val index = Index.Builder(result).index("metrics").type("metric").id(UUID.randomUUID().toString()).build()
    client.execute(index)
  }
}

fun main(args: Array<String>) {
  SpringApplication.run(JolokiaElasticApplication::class.java, *args)
}| 1 | Of course, it’s a Spring Boot application. |
| 2 | To poll at regular intervals, it must be annotated with @EnableScheduling |
| 3 | And have the polling method annotated with @Scheduled and parameterized with the interval in milliseconds. |
| 4 | In Spring Boot application, calling HTTP endpoints is achieved through the RestTemplate.
Once created - it’s singleton, it can be (re)used throughout the application. |
| 5 | The call result is deserialized into a String. |
| 6 | The client to use is Jest.
Jest offers a dedicated indexing API: it just requires the JSON string to be sent, as well as the index name, the object name as well as its id.
With the Spring Boot Elastic starter on the classpath, a JestClient instance is automatically registered in the bean factory.
Just autowire it in the configuration to use it. |
At this point, launching the Spring Boot application will poll the business app at regular intervals for the specified metrics and send it to Elasticsearch. It’s of course quite crude, everything is hard-coded, but it gets the job done.
Conclusion
Despite the failing plugin, we managed to get the JMX data from the business application to Elasticsearch by using a dedicated Spring Boot app.
The complete source code for this post can be found on GitHub.