

I have presented my OpenTelemetry demo many times, and I still do. Each time, the audience is different. To make no two presentations the same, I always ask attendees what stack they are more interested in. I also regularly add new features for the same reason.
I was a victim of the IT crisis last summer, and my company fired me, so I no longer work on Apache APISIX. They say that the Chinese ideogram for crisis contains the ideogram for opportunity. I used this opportunity to join LoftLabs. LoftLabs offers a cluster virtualization solution called vCluster.
Hence, this batch of changes to the demo has a lot of Kubernetes-related features.
From Docker Compose to Helm
Docker Compose is great for demos:
docker compose up, and you’re good to go, but I know no organization that uses it in production.
Deploying workloads to Kubernetes is much more involved than that.
I’ve used Kubernetes for demos in the past;
typing kubectl apply -f is dull fast.
In addition to GitOps, which isn’t feasible for demos, the two main competitors are Helm and Kustomize.
I chose the former for its ability to add dependencies.
Helm subcharts for the win!
I started to migrate by creating my own Helm templates for infrastructure. While it worked, it was hugely inefficient. In the end, I used the following Helm Charts as sub-charts in my infra chart:
At the start, I kept a custom Jaeger manifest because the official Jaeger Helm Chart doesn’t provide a way to expose the UI outside the cluster. Then, I realized that I was using Traefik and that I could use it. It’s precisely the architecture I used on Docker Compose with Apache APISIX.
I did keep a custom-made manifest for Mosquitto, but that’s because the official one doesn’t add benefit IMHO: you need a config file.
Kubernetes topology
Besides OpenTelemetry, I want to highlight the capabilities of vCluster.
For this reason, I separate the different Docker Compose services into two groups:
an infrastructure group (Traefik, Jaeger, Valkey, Mosquitto, and an OpenTelemetry Collector) and an app group (PostgreSQL, Mosquitto, the OTEL Operator, an OTEL collector, and all apps).
I deploy infrastructure-related pods on the host cluster and the app pods in a dedicated virtual cluster’s default namespace.
helm upgrade --install vcluster vcluster/vcluster --namespace otel --values helm/vcluster.yaml (1)
helm upgrade --install otel-infra infra --values helm/infra/values.yaml --namespace otel       (2)
vcluster connect vcluster                                                                      (3)
helm upgrade --install otel-apps apps --values helm/apps/values.yaml (4)| 1 | Create the virtual cluster in the otel namespace |
| 2 | Deploy infrastructure pods in the otel namespace on the host cluster |
| 3 | Connect to the virtual cluster. I’m now in a completely isolated Kubernetes cluster. Only we know it’s a virtual one. |
| 4 | Schedule infrastructure pods in the default namespace of the vcluster virtual cluster |
Traefik as an Ingress Controller
When I stopped working on APISIX, I decided to see how API Gateways worked and migrated to KrakenD on Docker Compose. For basic usage, it’s simple enough.
I wanted to try another one on Kubernetes. I chose Traefik because my searches mentioned it was the easiest to use in Kubernetes. As I mentioned, Traefik provides a Helm Chart, which makes it easy to install. Additionally, it integrates with OpenTelemetry.
traefik:
  fullnameOverride: traefik
  deployment:
    replicas: 1
  gateway:
    enabled: false
  rbac:
    enabled: true
  ports:
    web:
      nodePort: 30080
  tracing:
    otlp:
      enabled: true                    (1)
      grpc:
        enabled: true                  (2)
        endpoint: collector:4317       (3)
insecure: true (4)| 1 | Enable OpenTelemetry |
| 2 | Prefer gRPC over HTTP |
| 3 | Set the collector endpoint |
| 4 | Security is not the point of the demo |
Exposing services and the Ingress class
The idea of scheduling infrastructure pods on the host cluster and apps pods in the virtual cluster is excellent from an architectural point of view, but how do the latter access the former?
You probably use Service to access pods inside the same cluster.
Services provide a stable IP over pods that come and go.
Across regular clusters, you’ll need an Ingress Controller or a Gateway API implementation.
vCluster offers a straightforward alternative.
In the demo, I must:
- Access services on the host cluster from pods scheduled on the virtual cluster
- Configure Ingresses on the virtual cluster with an Ingress class whose Ingress Controller is deployed on the host cluster
As seen above, we can configure both when we create the virtual cluster.
networking:
  replicateServices:
    fromHost:
      - from: otel/valkey-primary      (1)
        to: default/cache
      - from: otel/jaeger              (1)
        to: default/tracing
      - from: otel/traefik              (1)
        to: default/ingress
      - from: otel/mosquitto           (1)
        to: default/messages
sync:
  toHost:
    ingresses:
enabled: true (2)| 1 | Synchronize a Service from the host cluster to the virtual cluster.
The pattern is <namespace>.<name> |
| 2 | Ingresses deployed on the virtual cluster are collected on the Ingress Controller configured on the host cluster |
A touch of the OpenTelemetry collector
I chose not to use an OpenTelemetry Collector in the Docker Compose setup because it didn’t add anything. With the new two-cluster architecture, it was beneficial to introduce one per cluster.
At first, I configured each Collector to add a custom tag regarding the cluster type, host or virtual.
Then, I discovered that the Collector Helm Chart provided a Kubernetes preset.
opentelemetry-collector:
  image:
    repository: "otel/opentelemetry-collector-k8s"
  fullnameOverride: collector
  enabled: true
  mode: deployment
  presets:
    kubernetesAttributes:
      enabled: true
It automatically adds Kubernetes-related data. Here’s the result in one of the app pods:
| Key | Value |
|---|---|
|
|
|
|
|
|
|
|
|
|
|
|
|
|
Initializing PostgreSQL with data
The "official" PostgreSQL Docker image allows initializing the database via SQL scripts.
You only need to mount the scripts folder to the container’s /docker-entrypoint-initdb.d folder.
When the container starts, it will run these scripts in alphabetical order.
On Kubernetes, I started to write all the scripts' content in a static ConfigMap, but I didn’t find this approach maintainable.
Given I’m using a Helm Chart, I thought I could find a better way, and I did.
I put all the scripts in a dedicated files/sql folder in the Helm Chart.
Then, I wrote the following template to concatenate them in a ConfigMap:
apiVersion: v1
kind: ConfigMap
metadata:
  name: postgres-init-scripts
  namespace: {{ .Release.Namespace }}
data:
{{- $files := .Files.Glob "files/sql/*.sql" }}      (1)
{{- range $path, $content := $files }}             (2)
  {{ base $path }}: >                             (3)
{{ $content | toString | indent 4 }}              (4)
{{- end }}| 1 | List all files under the files/sql/ folder |
| 2 | Iterate through all files |
| 3 | Write the file name |
| 4 | Write the file’s content |
At this point, we can use the ConfigMap in the global Helm file under the PostgreSQL section:
postgresql:
  primary:
    persistence:
      enabled: false
    initdb:
      scriptsConfigMap: postgres-init-scripts
Kubernetes instrumentation of pods
I recently learned that Kubernetes could instrument pods running certain technologies with OpenTelemetry. I wanted to try it out, so I added a new OpenTelemetry-free Python-based image to the overall architecture. It’s a two-step process:
- Install the OpenTelemetry Operator
- Apply an
Instrumentor:apiVersion: opentelemetry.io/v1alpha1 kind: Instrumentation metadata: name: demo-instrumentation spec: exporter: endpoint: http://collector:4318 (1) propagators: (2) - tracecontext - baggage sampler: type: always_on (3)
| 1 | Configure the OpenTelemetry collector endpoint |
| 2 | Set the propagators |
| 3 | I want all the traces for my demo; in production environments, you’d probably want to sample them |
At this point, when we schedule pods, Kubernetes will pass them through a new mutating webhook. If the pod has annotations that the instrumentation recognizes, the latter will add a sidecar that instruments the main pod with OpenTelemetry. For the Python app I mentioned above, it looks like the following:
apiVersion: apps/v1
kind: Deployment
metadata:
  name: recommendations
  labels:
    app: recommendations
spec:
  replicas: 1
  selector:
    matchLabels:
      app: recommendations
  template:
    metadata:
      annotations:
        instrumentation.opentelemetry.io/inject-python: "true"     (1)
      labels:
        app: recommendations
    spec:
      containers:
        - name: recommendations
image: recommendations:1.0| 1 | The mutating webhook instruments the pod with the Python-specific image |
Here’s a screenshot of the resulting traces:
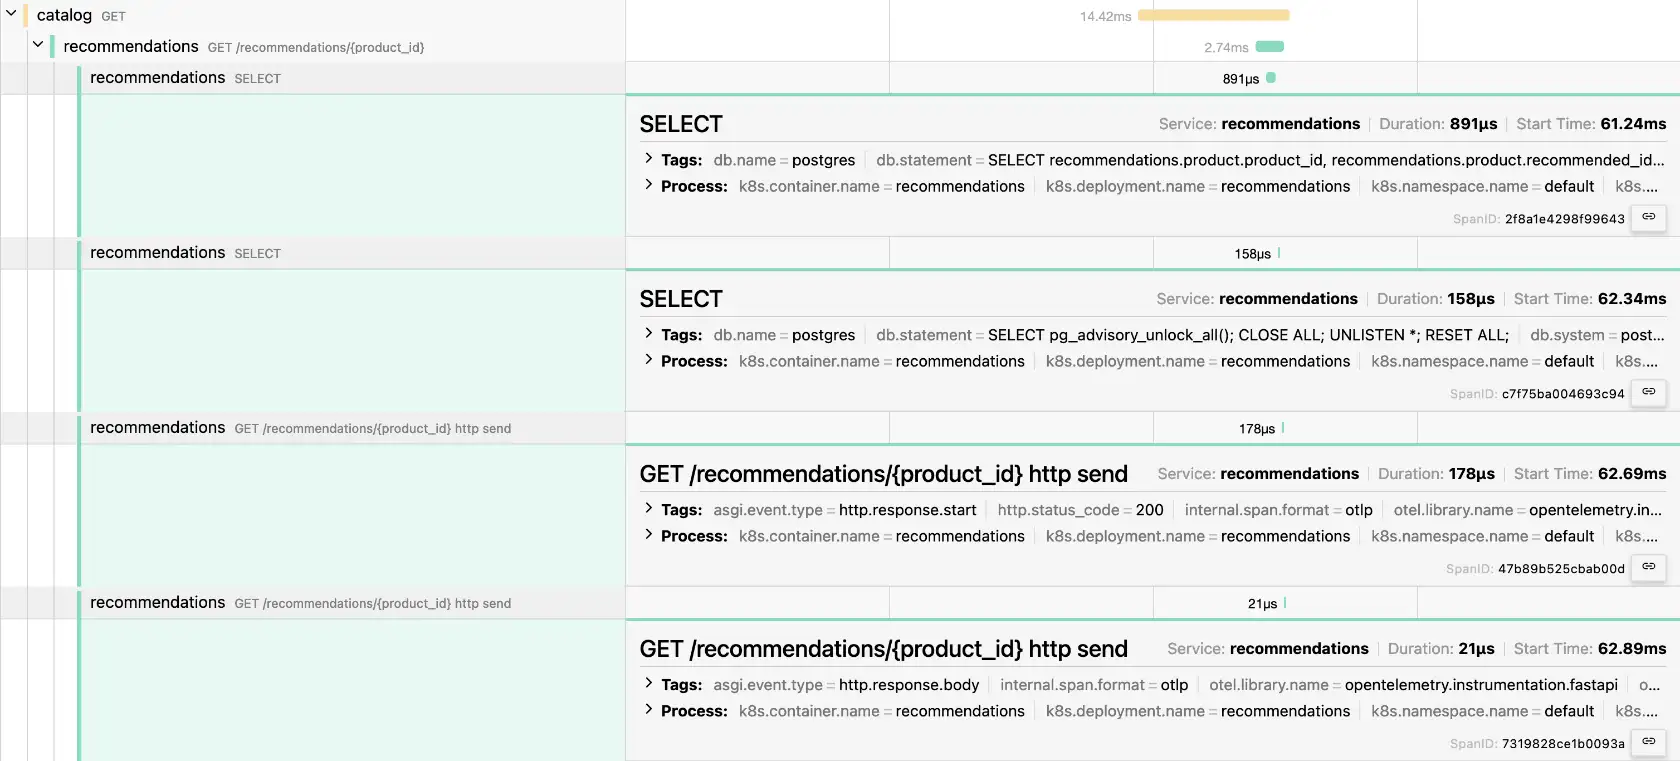
What’s impressive is that it’s all based on Kubernetes. Neither the app developer nor the container build had to do anything related to OpenTelemetry.
A new Quarkus component
This last section is unrelated to Kubernetes. I’m already using Spring in two components for the demo, one instrumented with the OpenTelemetry Java agent and the other with Micrometer Tracing and compiled with GraalVM native. I wanted to demo the OpenTelemetry integration capabilities of Quarkus.
You only need two dependencies for auto-instrumentation:
<dependency>
<groupId>io.quarkus</groupId>
<artifactId>quarkus-opentelemetry</artifactId>
</dependency>
<dependency>
<groupId>io.opentelemetry.instrumentation</groupId>
<artifactId>opentelemetry-jdbc</artifactId>
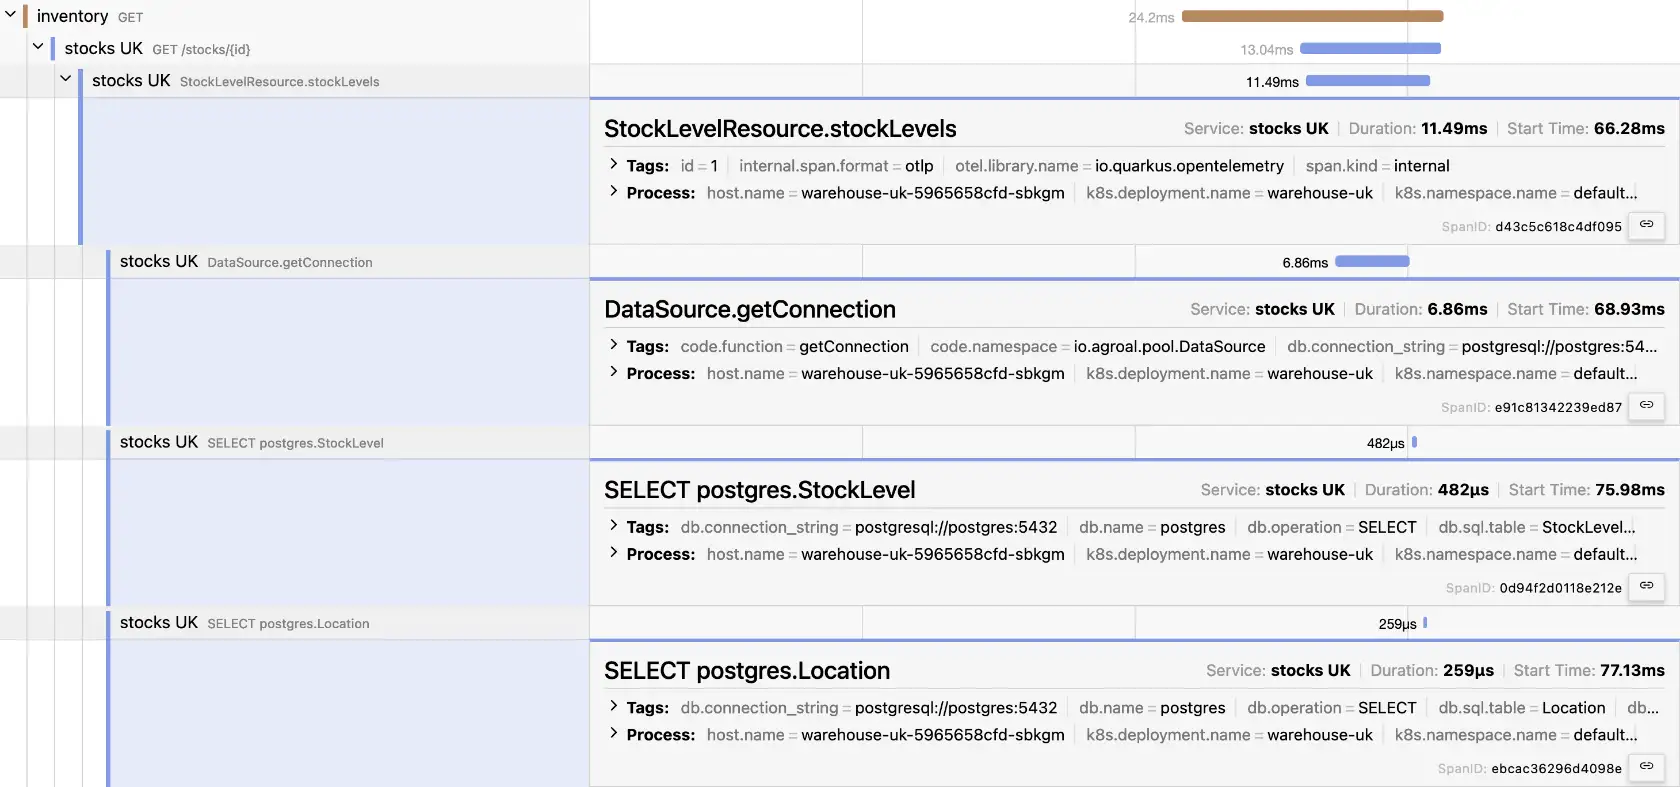
</dependency>You can customize the traces with annotations:
@Path("/stocks")
@Produces(MediaType.APPLICATION_JSON)
public class StockLevelResource {

    private final StockLevelRepository repository;

    @Inject
    public StockLevelResource(StockLevelRepository repository) {
        this.repository = repository;
    }

    @GET
    @Path("/{id}")
    @WithSpan                                                      (1)
    public List<StockLevel> stockLevels(@PathParam("id") @SpanAttribute("id") Long id) { (2)
        return repository.findByProductId(id);
    }
}| 1 | Add a new span whose value is the method’s name |
| 2 | Add a new id attribute whose value is the `id’s value at runtime |
Summary
I added a couple of new features to my existing OpenTelemetry demo:
- Migrating from Docker Compose to Kubernetes
- Installing via Helm Charts
- Using vCluster to isolate the app pods from the infrastructure pods
- Using Traefik as an Ingress Controller
- Installing an OpenTelemetry collector instance in each cluster
- Instrumenting an OpenTelemetry-free app with the Kubernetes Instrumentation
- Adding a new Quarkus application
I’m always happy to add new components that feature a new stack. At the moment, I’m thinking .Net is missing from the landscape. Suggestions and PRs are welcome!